


Physics of Ultrasonic Pulse Velocity (UPV) Testing of Concrete – How it works?
UPV is based on transmitting an ultrasonic signal (or pulse) and accurately measuring the travel time of acoustic waves in the medium (Concrete), through a pre-measured distance (or thickness) of the material, based on the travel time, velocity is computed and correlated to the elastic properties and density of the material (Concrete in this case).
The travel time of ultrasonic waves is indicatively of the internal condition and composition of test material /area. As a rule of thumb, for a given length / thickness higher travel time (slowness and lower velocity) is indicative of low-quality concrete with anomalies, deficiencies including high porosity, air-pockets, honeycombing, Concrete segregation, lower density due to poor vibration
In contrast, lower travel time (faster and higher velocity) is indicative of higher quality concrete with fewer anomalies, much less defects and high homogeneity. Once ultrasonic wave spreads within the test area, the wave is reflected in boundary of anomalies resulting in higher travel time. This results in higher transmission time (lower wave speeds) in poor quality concrete and lower transmission time (higher wave speed) in good quality concrete.
Applications of Ultrasonic Pulse Velocity UPVU Testing of Concrete
- Pulse Velocity Determination
- Concrete Quality Assessment
- Establishing Homogenity and Uniformity of Concrete
- Measurement of Surface Crack Depth
- Prediction of Compressive Strength of Concrete
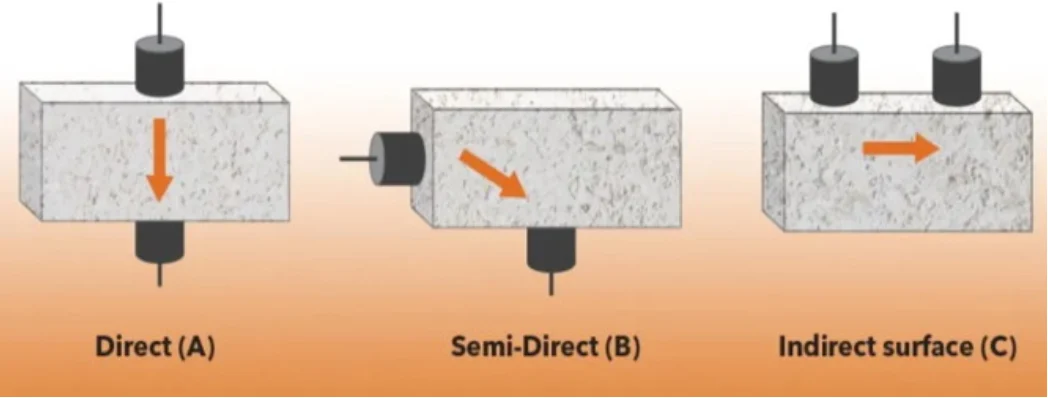
UPV Testing Configurations
Different configurations of transducers can be used to perform a UPV test. This includes direct transmission, semi-direct transmission, and indirect (surface) transmission. Figure above shows different configurations of transducer based on the access to the surface of test area. The ultrasonic velocity is prone to signal travel trajectory that is defined by the transducer configurations. Figure below is a representation of the effect of concrete anomalies and deficiencies on the acoustic wave travel time and the corresponding velocity throughout a given trajectory (ACI 228.2R, 2013).
Data Acquisition
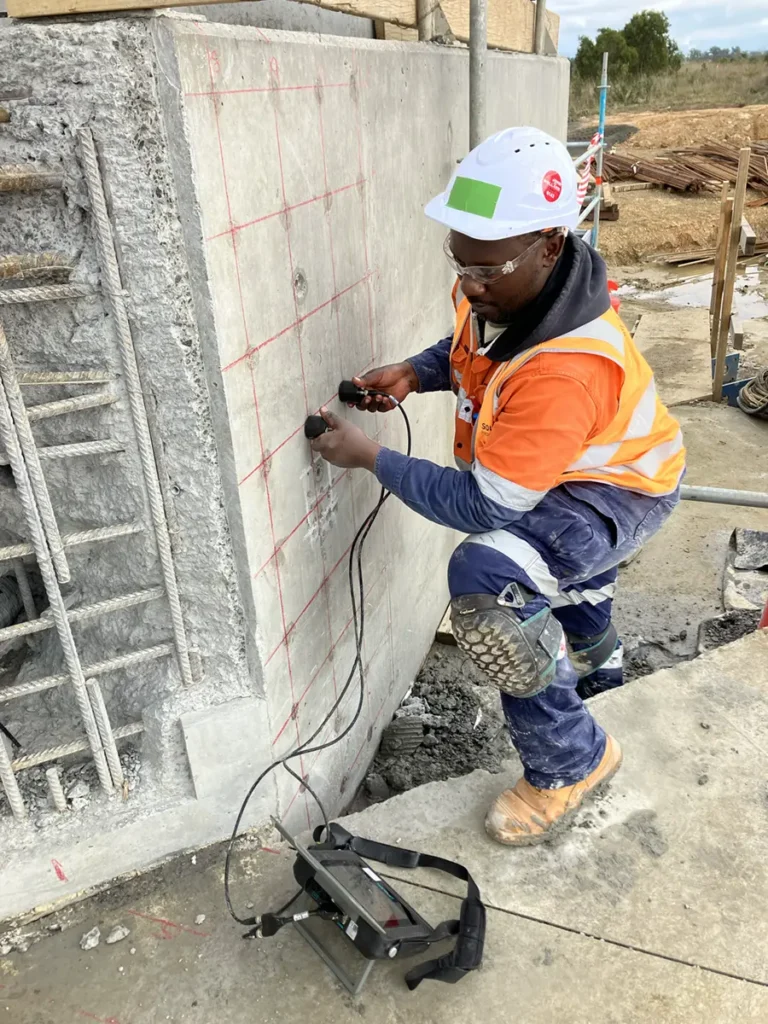
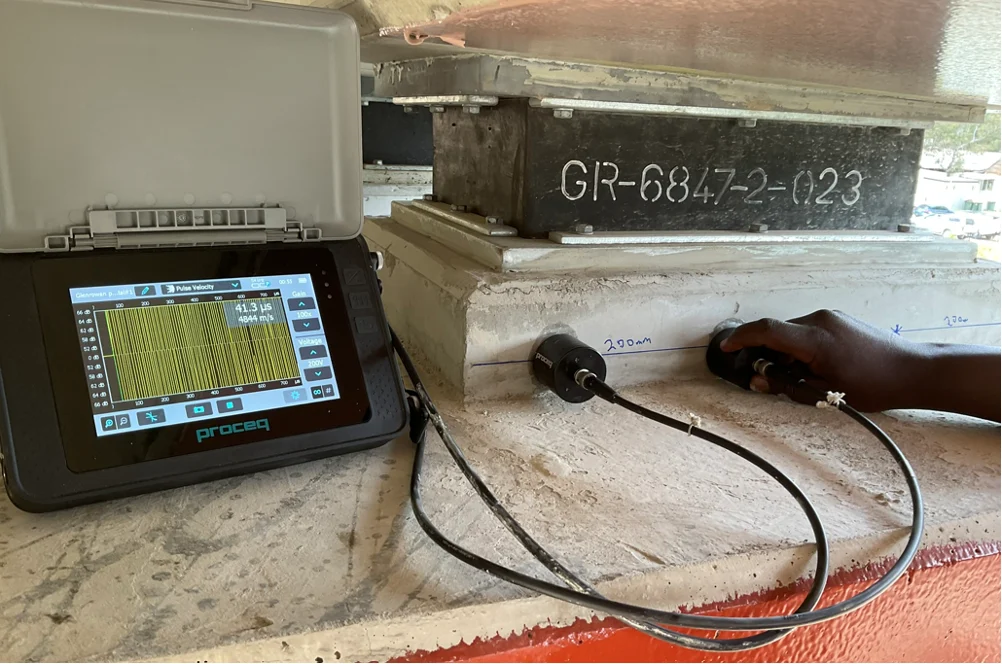
Indirect UPV testing: illustration of indirect UPV measurements being conducted at pre-measured distances between the transducer (transmitter (Tx)- Receiver (Rx) spacing along the width the Concrete body under investigation.
Surface preparation was conducted, in accordance with industry standards ASTM C597 / BSI 98/105795 DC / ACI 228.2R Standard, the surface was smoothened, freed from all loose material and a coupling agent was applied.
Data Acquisition
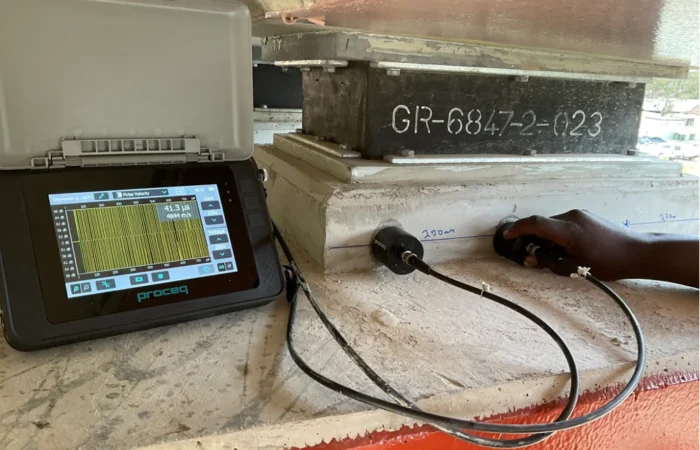
Indirect UPV testing: illustration of indirect UPV measurements being conducted at pre-measured distances between the transducer (transmitter (Tx)- Receiver (Rx) spacing along the width the Concrete body under investigation.
Surface preparation was conducted, in accordance with industry standards ASTM C597 / BSI 98/105795 DC / ACI 228.2R Standard, the surface was smoothened, freed from all loose material and a coupling agent was applied.
Direct UPV testing: illustration of Direct UPV measurements being conducted at pre-measured distance (L) between width edges, with the transducer (transmitter (Tx)- Receiver (Rx) along the width edges of the Concrete body under investigation.
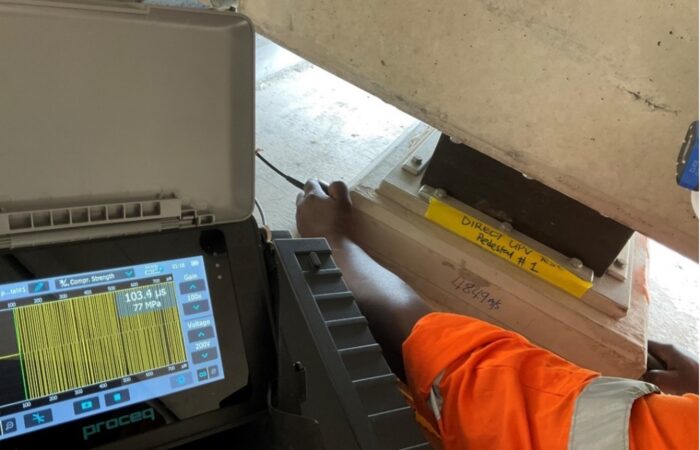
Surface preparation was conducted, in accordance with industry standards ASTM C597 / BSI 98/105795 DC / ACI 228.2R Standard, the surface was smoothened, freed from all loose material and a coupling agent was applied.
Surface Preparation and Couplant for Transducer contact
Surface preparation should be conducted in accordance with industry standards (ASTM C 597, 2016), BSI 98/105795 DC and ACI 228.2R. This should include removal of loose Concrete, bumps, debris, dust and coatings to ensure maximum contact and coupling of transducers to the Concrete surface hence high data quality. Standard with minimal air pockets between the transducer and concrete that may result in significant measurement errors due to poor contact.
Furthermore, to improve transducer coupling to material, different recommended coupling materials can be used to eliminate air pockets and to assure good contact (e.g. petroleum jelly, grease, liquid soap, and kaolin-glycerol paste). It is recommended to make the couplant layer as thin as possible.
GPR Scanning, marking positions of Steel Reinforcement in both directions X and Y and marking a data acquisition grid for UPV data collection, specific attention in marking the grid, positioning of UPV transducers relative to positions of Steel reinforcement bars to avoid velocity false highs considering Ultrasonic Velocities are much higher in Steel compared to Concrete.
UPV RESULTS AND INTERPRETATION
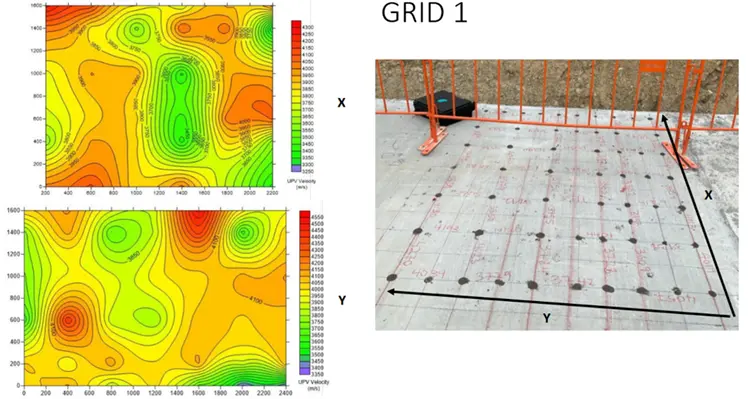
Interpretation of Results: Below is a mapping of Ultrasonic Pulse Velocity UPV velocity distribution across Grid #1 (both in X and Y axis orientations), though there are relative variations in UPV velocities, qualitative interpretation of the above should be in accordance to industry standard Concrete quality grading categorisation guidelines above. The relatively lower Velocity parts (Green) correspond to UPV Velocity 3500-3550 m/s categorised as Good Concrete Quality. Relatively low velocity at lower bottom edge (coordinates 2000-2400, 0).
Factors influencing UPV results
The following issues should be addressed before, during, and after performing the test:
- Quality of Surface Preparation (Clean / unclean, dust, debris / lose Control)
- Presence of Steel Reinforcement or measurements being over / very near Rebar GPR Scanning, marking positions of Steel Reinforcement in both directions X and Y and marking a data acquisition grid for UPV data collection, specific attention in marking the grid, positioning of UPV transducers relative to positions of Steel reinforcement bars to avoid velocity false highs considering Ultrasonic Velocities are much higher in Steel compared to Concrete.
- Concrete Properties (aggregate size, type, and content)
- Transducer Contact/couplant material to improve transducer coupling to material, different recommended coupling materials can be used to eliminate air pockets and to assure good contact (e.g. petroleum jelly, grease, liquid soap, and kaolin-glycerol paste). It is recommended to make the couplant layer as thin as possible.
- Sensor Configuration (Direct, indirect, semi-direct): The direct configuration is the most ideal for getting reliable readings; however, the use of this configuration is mainly limited to accessibility ( top and bottom of slab, Columns, Beams, Pedestals/ inner and outer walls)