


The Crosshole Sonic Logging (CSL) is the industry standard non-destructive test for quality assurance and quality checking of the integrity of Concrete piles and deep foundations structures including Bridge Abutments, multi-level buildings, Telecommunication towers, Dam walls, Weirs etc.
CSL test can be considered a form of direct configuration of Ultrasonic Pulse Velocity (UPV). In actual terms, like ultrasonic pulse velocity in concrete, so is Crosshole Sonic Logging (CSL) they are a function of (dependent on) the intrinsic properties of the Concrete including modulus of elasticity, density, Concrete grade / quality, homogeneity, Poisson’s ratio and geometric aspects specifically spacing of Transmitter to Receiver.
Technology Standard in accordance with ASTM D6760-16, ASTM D5882-16, ASTM D2845-08, ASTM C597-16, UNI EN 12504-4 industry standard.
Objectives of CSL
Cross hole Sonic Logging (CSL) is the industry standard Test for identifying anomalies or potential defects in concrete shafts / piles such as:
- Necking in piles and changes in Cross-section
- Soil inclusion / intrusion into the Concrete due to collapse of soil walls
- Non-homogeneity of Concrete and Segregation
- Voids, air pockets and porosity, poor quality concrete (low density, low modulus), and major voids.
Physics and logic of Cross hole Sonic Logging (CSL)
The uniformity, integrity and defects within a Concrete pile can be assessed by measuring the pulse velocity at different elevations (vertical and lateral levels) across the pile profile by transmitting a known ultrasonic frequency pulse from the transmitter probe (Tx) and accurately measuring travel time (arrival time) to the Receiver probe (Rx) through the section (length) of Concrete under test. Based on the travel time (T) and known distance between test tubes, the Velocity of Concrete and arrival times are logged for further analysis.
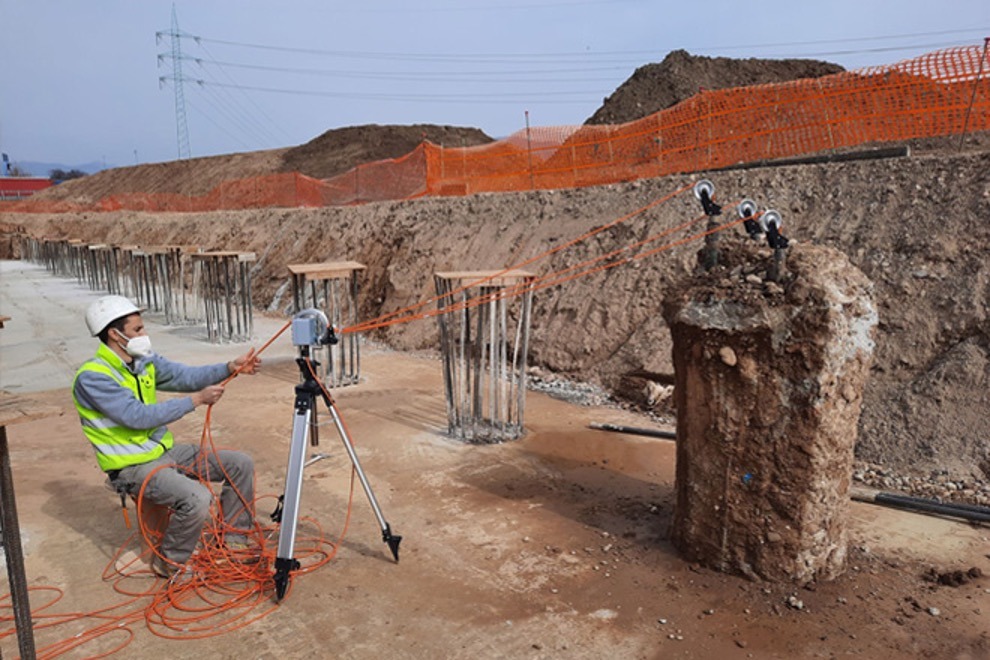
How Crosshole Sonic Logging (CSL) testing is conducted.
For crosshole sonic logging test to be implementable in a Concrete pile, prior to casting (Concrete placement) a number of pre-installed access tubes are built inside the reinforcement cage, accurately aligned for verticality and spacing between tubes as per design prior to placing concrete.
During the CSL testing, the tubes are filled with water to provide acoustic coupling to the ultrasonic transducers (transmitter and Receiver).
The simplest testing configuration entails at least two parallel tubes installed, but typically, depending on the size (diameter of the pile), multiple test tubes may are installed, and crosshole sonic logging testing is conducted across multiple combinations of transmitter Tx / receiver Rx tube pairs.
Testing and Data acquisition
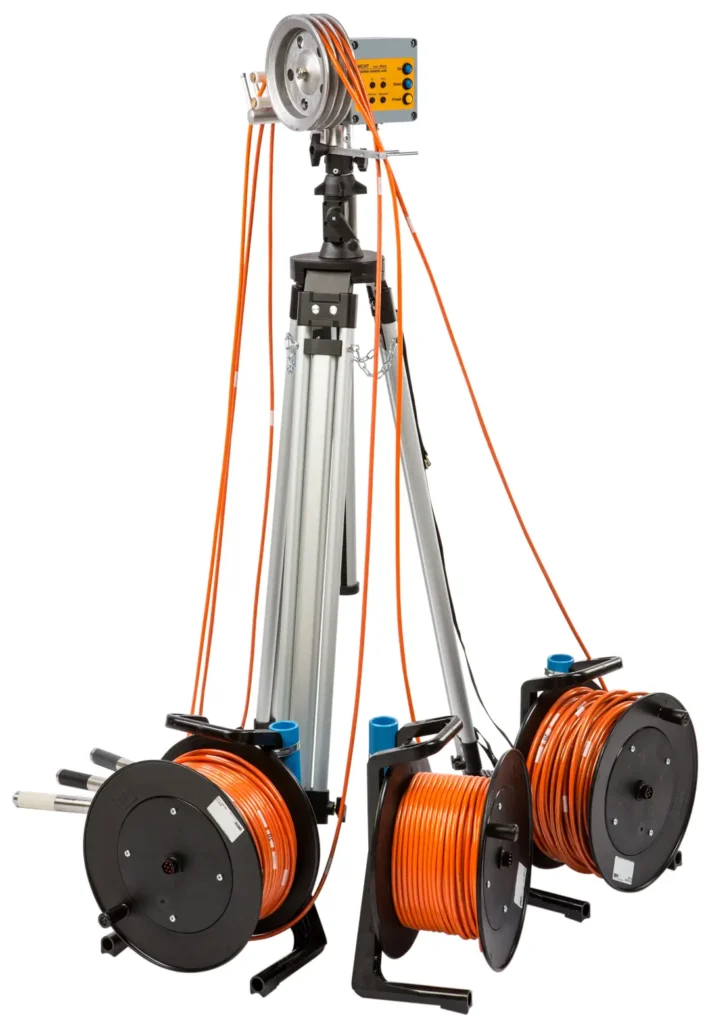
In the testing and data acquisition process, Two transducers (a transmitter and a receiver) are lowered down to the bottom of the shaft, and are pulled up. The transit time of an ultrasonic pulse (from transmitter Tx / receiver Rx transducer) through the concrete between the tubes is measured by a data logger. As the transducers are pulled up (simultaneously and together), the ultrasonic pulse signal is collected at certain intervals along the depth of the Concrete pile, a continuum of depth positions (of probes) precisely recorded by distance incremental encoders in modern CSL systems.
The transit time of ultrasonic pulse between every pair (two) access tubes is measured with high precision data acquisition system.
Optimum frequency and Resolution
The resolution of the scan along elevation can be controlled by the rate of the withdrawal of the transducers in the tube (normally performed form the bottom to top). The resolution of the scan at each depth position depends on the following factors:
- selected frequency (pulse wavelength),
- the horizontal spacing of access tubes.
- number of access test tubes
Resolution of Cross hole Sonic Logging (CSL)
Modern Cross hole Sonic logging (CSL) systems are equipped with transducers ranging between 25 to 50 kHz frequencies, enabling identification and resolution of defects as small as 2.5” to 4” (in each horizon).
Data Output
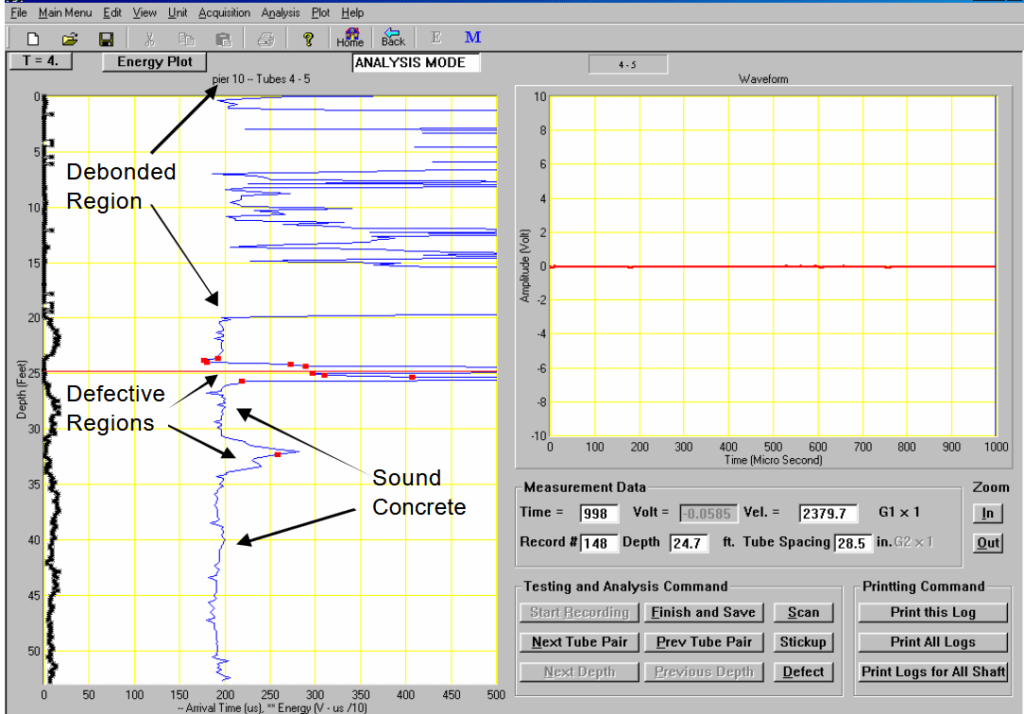
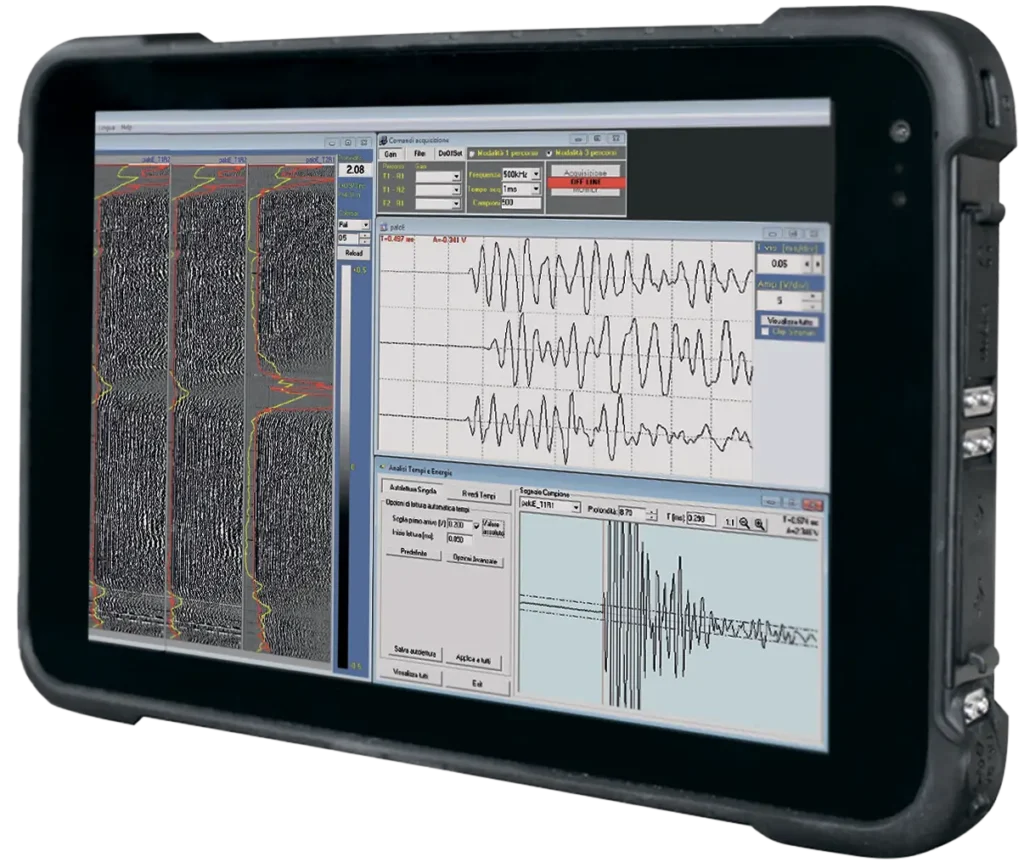
CSL data logging provides engineers with a vertical profile of signal transit time along the entire depth of the Concrete pile. Typically, the results are presented in Waterfall formart as a guide to detailed analysis of:
- first arrival time (FAT), uniformity / variations in pulse times (FAT) along the depth of the pile.
- a logging propagated signal energy (in decibel dB units) offering a parallel analysis of the energy characteristic, uniformity/ variations in energy and identifications of zones of significant losses in pulse energy.
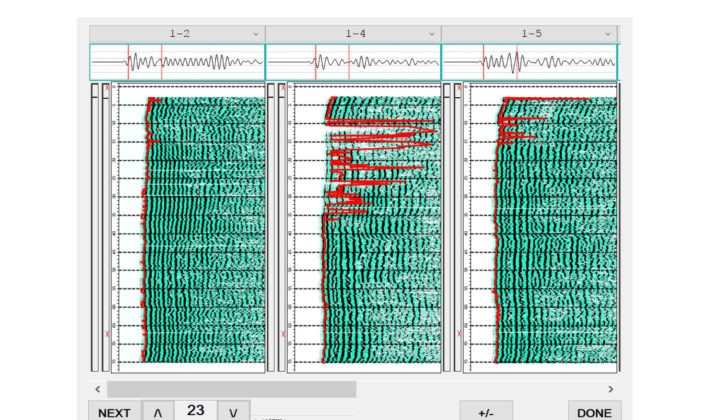
Typically, the results are presented in Waterfall formart as a guide to identifying anomalies or potential defects in concrete shafts / piles such as
- Necking in piles and changes in Cross-section
- Soil inclusion / intrusion into the Concrete due to collapse of soil walls
- Non-homogeneity of Concrete and Segregation
- Voids, air pockets and porosity, poor quality concrete (low density, low modulus), and major voids.
Analysis of CSL Results
Crosshole Sonic Logging test results are often presented in Waterfall format.
Waterfall Method of Analysis of data
The Waterfall format presents CSL results as a graphical profiling logging of ultrasonic pulse times from bottom to top along the depth of the pile. As rule of thumb, the positive peaks are presented by a dash line, whose width matches that of the original peak, and each negative peak is illustrated as a gap, creating a dashed line. These measurements are presented as a series of dash-lines along the shaft elevation, which allows for a more detailed review of the wave train, even when the first arrival cannot be detected.
First Arrival Time (FAT) method of analysis of data
In the FAT analysis method, the arrival time of the first peak in the ultrasonic pulse wave train is recorded as the First Arrival Time, (FAT), and the overall amplitude of the early part of pulse is measured. A practical challenge in the FAT method is distinguishing between peaks in the wave train, and the noise in the construction site. This is often performed through filtering out the noise by assigning a threshold value.
2D / 3D Cross hole Tomography analysis of data
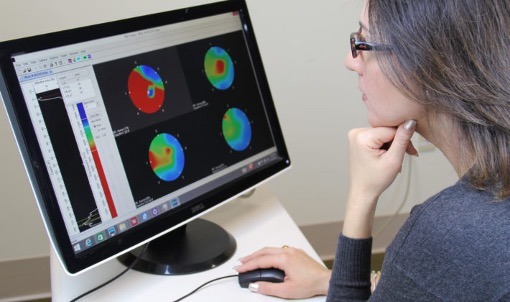
To supplement the FAT analysis, 2D/3D tomography outputs can be generated to offer a visual presentation of the position of anomalies, defects, severity of defects, size, shape of defects and extent of defect at each depth position along the shaft.
Note: If the CSL test results does not show any anomalies in the shaft, performing tomography test does not provide any extra information.
Verification of CSL anomalies by Offset CSL test Cross hole Tomography analysis of data
Depending on the criticality of the structure, sometimes, identification of significant and high severity anomalies in regular CSL testing (with horizontal setup of probes) may warrant other additional forms of Cross hole sonic logging testing to be performed with transducers offset vertically (not horizontal) to provide angled pulse paths for better illumination of the defect(s). This enhances the geotechnical engineer’s ability to locate, position and determine the area and size of the defect with increased accuracy.
Limitation of Cross hole Tomography analysis of data
Crosshole Tomography is subject to limitations related to”
- Pulse travel path geometry specifically effectively measuring the travel path of the pulse (which may not be along a straight line in most cases).
- Variation in tube spacing. The positioning (spacing) of the access tubes might change along the pile depth which unknowingly will cause errors in pulse travel time.
Note: If the CSL test results does not show any anomalies in the shaft, performing tomography test does not provide any extra information.
Anomaly characterisation and classification in Crosshole Sonic Logging data analysis
For standardisation of terminology and for ease of understanding, the following terminologies and interpretation of CSL have were clarified by the Deep Foundations Institute (DFI).
- Anomaly: Abnormal data that deviates from expectations and may indicate a flaw or defect.
- Flaw: Any imperfection in the planned shape or material of the foundation that may not necessarily affect its performance.
- Defect: Any flaw that, because of size, location and inferred concrete properties, will have a significant adverse effect on the performance of the foundation.
Anomaly characterisation and classification
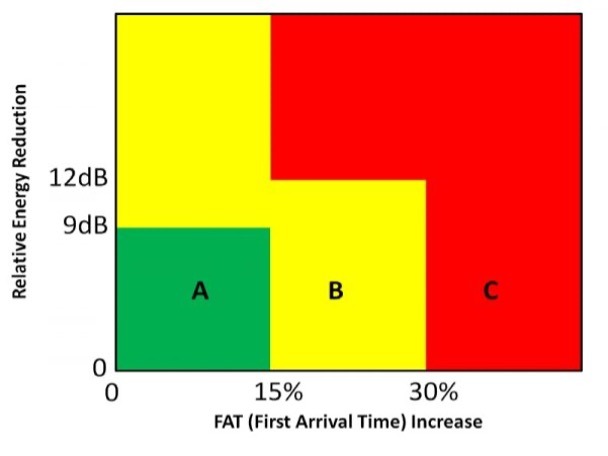
Three different categories have been identified for interpretation.
- Class A: Acceptable CSL test results.
- Class B: Conditionally acceptable CSL test results.
Class C: Highly abnormal CSL test results.
Key Advantages of Crosshole Sonic Logging
- The interpretation of the test results in CSL test is relatively easier, more figurative and offers multiple parameters of analytical comparison (compared to other tests, such as the low strain pile integrity test).
- In theory, there is no limitations with regards to shaft length or diameter, the only limitation would be the length of data cables or limitations of wireless communications with modern day systems.
- The test results are not affected by skin friction, variation in soil stiffness, or damping characteristics.
- The test can be further enhanced by implementing a diagonal positioning of the probes (in which the elevation of transmitting transducer has an offset with the receiving transducer). This would enable engineers in creating 2D and 3D maps of defects inside shaft.
Practical Limitations
- The main disadvantage of the test relates to the fact that most access tubes are installed inside the steel reinforcement cage. This would limit the amount of information that can be obtained from concrete area that lies beyond the the steel cage (which happens to be the most problematic area in most cases).
- CSL test does not provide information about small horizontal defects.
- Another practical consideration is the installation of tubes. As the shaft dimeter increases, the minimum number of access tubes is also increased. This will increase the number of paths that need CSL measurement (labor intensive and time consuming).
Practical Considerations
Access Tubes : Steel or PVC ?
Success of any Crosshole Sonic Logging QA/QC programme starts at choosing and installation of the right type, size of access tubes and installing them correctly (verticality and uniform spacing between access tubes). Access tubes material can either be steel, or PVC.
Based on literature and industrial experiences PVC tubes are less reliable (in comparison to Steel tubes),as they’re prone to causing undesirable challenges such as debonding from the concrete, air-gaps / clearances due to the tendency of Plastic to lose its bond to concrete after a few weeks after Concrete placement. Such issues related to air-gap clearances due to debonding render CSL ineffective test method as ultrasonic wave cannot pass through air.
What is the proper size of Access Tubes?
Access tubes are typical 1 to 3 inches in diameter (40 mm – 50 mm). Access tubes are filled with water to provide acoustic coupling, as a result, they should be water tight at the ends to prevent the penetration of soil, groundwater and debris inside the tube.